
Snowguard - A Snowflake near-real time monitor for straggling queries
This article walks through the logic, technologies, and the high-level architecture we adopted to develop an inhouse near-real time monitor for long running queries on Snowflake.


Setting the stage
This post is inspired by our implementation of a Straggling Query Monitor (I fancy the name - Snowguard) for a Fortune 50 company, a global behemoth in its domain. As a backbone of our data platform, our Snowflake instances host over 800 TBs of data along with a daily ingestion rate of over 6 TB, including full and incremental loads. These huge data intensive computations are triggered by 300+ dbt workloads and 800+ Airflow jobs. All of this is developed, maintained, and monitored by a team of over 250+ members, ranging from engineers to analysts to data scientists and finally to techno-functional business folks.
Translated to query count analytics per month, we are talking about over 6 million queries (yes, 6+ million) and over USD 200,000 in incurred costs. Let that sink in! Add the fact that Snowflake virtual warehouses (those nifty compute engines for Snowflake queries) can actually run for days, weeks, and months at a stretch without terminating and you have a recipe for disaster! True to form, we found orphaned or abandoned queries running for hours and even days on end frequently, only to be terminated with no outcomes achieved, costing us thousands of dollars in wasted credits.
The pursuit of solutions
We started looking into off-the-shelf capabilities that would flag these straggler queries in near real-time and help reduce our credit wastage. However, from native Snowflake solutions such as Resource Monitors to third-party Saas offerings like Slingshot by CapitalOne, a common limitation stood out - They all offered the capability to get information about long running queries AFTER they had completed, directly breaching our “near real-time” requirement.
Seeds of Snowguard
We started working on a prototype solution with a few assumptions -
It had to be a Snowflake native solution as we wanted to avoid increasing the chances of integration failure by adopting any third-party tool or technology.
It didn’t matter how frequently our monitor had to run throughout the day to flag straggling queries.
Action on flagged queries had to be taken manually to prevent terminations on legitimate long running queries such as back-fills on large tables. Governance guard rails should not end up stifling actual progress.
The alerts need to be sent to a Slack channel for cross-team visibility and swift resolution.
Road to Revolution
Keeping these assumptions in mind, we started working on a parameterized stored procedure that would extract the query information from information_schema.query_history table function, based on filters passed during the procedure call. This function returns detailed information for all queries (running, succeeded, or failed) in the account within a specified time range.
| SELECT | |
| warehouse_name, | |
| warehouse_size, | |
| database_name, | |
| schema_name, | |
| user_name, | |
| role_name, | |
| start_time, | |
| end_time, | |
| query_id, | |
| query_type, | |
| LEFT(query_text, 100) AS query_text, | |
| error_message, | |
| CURRENT_TIMESTAMP AS record_insert_time, | |
| 'https://app.snowflake.com/abcbaabc/hola1234/#/compute/history/queries?user=ALL&uuid=' || query_id AS query_hist_url | |
| FROM | |
| table(information_schema.query_history( | |
| END_TIME_RANGE_START => | |
| DATEADD('minutes', -TO_NUMBER(:P_LOOKBACK_MIN), CURRENT_TIMESTAMP()), RESULT_LIMIT => 10000)) | |
| WHERE duration_sec >= :P_DURATION_SEC | |
| AND execution_status = 'RUNNING' | |
| ORDER BY duration_sec DESC); |
In this query, P_LOOKBACK_MIN and P_DURATION_SEC are parameters passed into the stored procedure call. The results of this query are then aggregated into an ARRAY object and stored via bind variables:
| SELECT | |
| COUNT(*), | |
| (SELECT | |
| CURRENT_ACCOUNT()), | |
| ARRAY_AGG | |
| ( | |
| OBJECT_CONSTRUCT( | |
| 'warehouse_name', warehouse_name, | |
| 'warehouse_size', warehouse_size, | |
| 'database_name', database_name, | |
| 'schema_name', schema_name, | |
| 'user_name', user_name, | |
| 'role_name', role_name, | |
| 'start_time', start_time, | |
| 'end_time', end_time, | |
| 'duration_sec', duration_sec, | |
| 'query_id', query_id, | |
| 'query_type', query_type, | |
| 'query_text', query_text, | |
| 'error_message', error_message, | |
| 'record_insert_time', record_insert_time, | |
| 'query_hist_url', query_hist_url) | |
| ) INTO :row_count, :account_id, :result_arr | |
| FROM ( | |
| -- This is where we put the above query as a subquery | |
| ); |
Now we check if any records are returned from the subquery, i.e. len(result_arr) > 0. If yes, we insert these records into a table - SQM_RESULTS. We automated this procedure using Snowflake tasks to execute every 10 mins.
For the other half of the solution, we turned to Monte Carlo.
Monte Carlo is a data observability and lineage tracking tool that helps get a granular understanding of the health and quality of the data across its lifecycle. By provide a wide range of data health monitors such as freshness, volume, anomaly and custom SQL, Monte Carlo enables organisations to take full control of their data quality.
For Snowguard, we setup Monte Carlo custom SQL monitors on the SQM_RESULTS table to create an alert for every new record inserted. These alerts would then be sent via Slack Notifications setup on Monte Carlo to our team slack channel.
Eureka!
An anxious few days of wait followed and then voila! We had our first straggler query alert sent to our Slack channel.
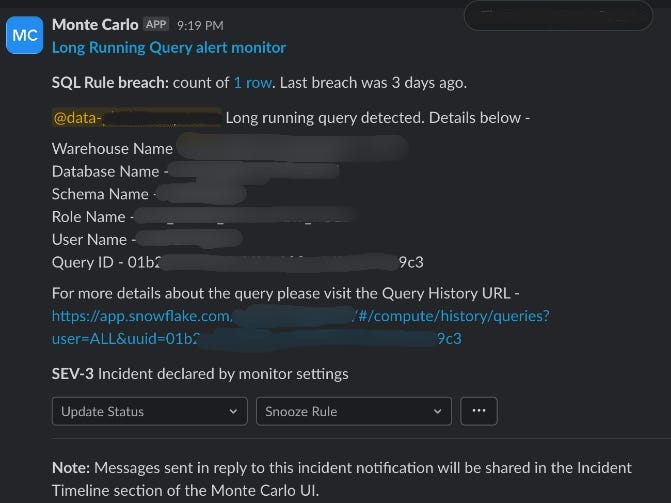
This alert is equipped with not just the query metadata details such as database, schema, and warehouse, but also the query history URL which enabled the teams to view the flagged query in just a single click.
The curious case of false negatives
With our solution now live and flagging alerts every time a query crossed the time threshold, our credit wastage was significantly reduced. But what followed was a long period of lull - no alerts in the channel for a few weeks on the trot. Was this because there were no straggling queries or did our monitor stop working as expected?
Boy, those edge cases sneak up on you, eh?
Further debugging using Snowflake’s account_usage.query_history view revealed that there were indeed no long running queries during this period. But now we had an interesting problem - to setup an alert if Snowguard itself stops working!
For this -
We added another INSERT statement at the end of our stored procedure that would insert the status of every execution along with the execution time stamp in a new table - SQM_STATUS. Now, every 10 minutes, this table would have a new SUCCESS entry, if everything ran as expected or a FAILURE/missing entry if something failed along the way.
We then setup another Monte Carlo custom SQL monitor to run every 15 minutes and check for an entry in the SQM_STATUS table with status=SUCCESS. Any instances where no results are returned are reported to the Slack channel as a possible health issue with Snowguard.
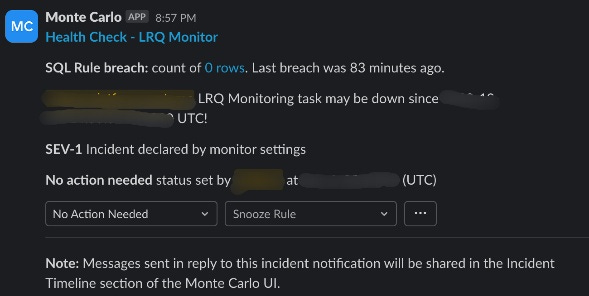
Voila, we now had an alert setup to track our beloved Snowguard’s health.
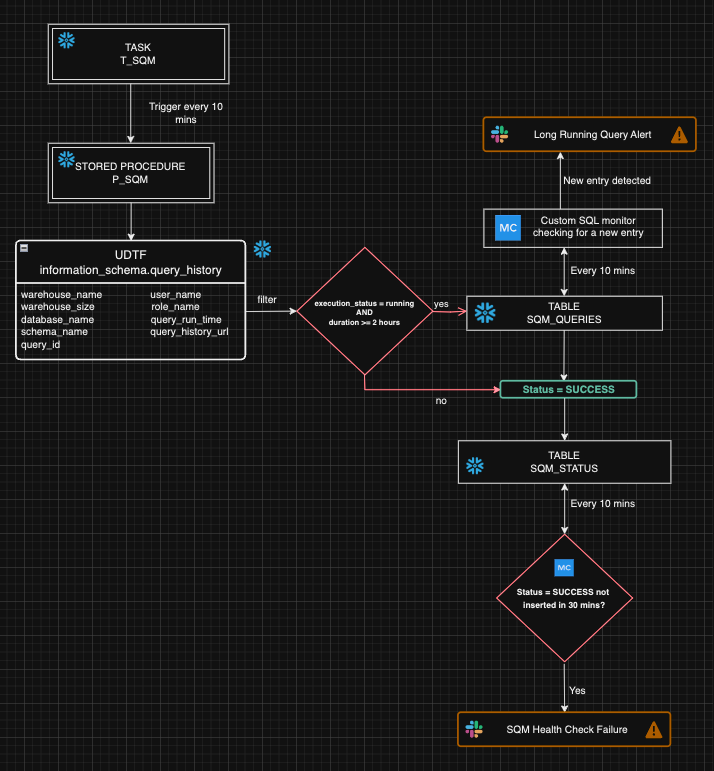
Architecture diagram
Having delved into the technical details of the Snowguard implementation, I feel that closing this newsletter without an architecture diagram would render it incomplete. This diagram will help you understand the control flow through its various components and help you design similar solutions at your place of work.
Do you have any comments, questions or suggestions on how to make this better? Do you have any points regarding the use of any alternate technology stack to enable similar or better levels of governance on Snowflake?
Let me know your thoughts in the comments below!